Weather analysis
6. Weather analysis#
Here you will find the
corresponding lecture slides.
Exercises
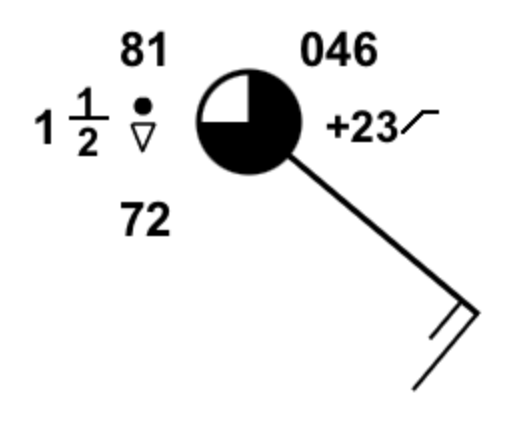
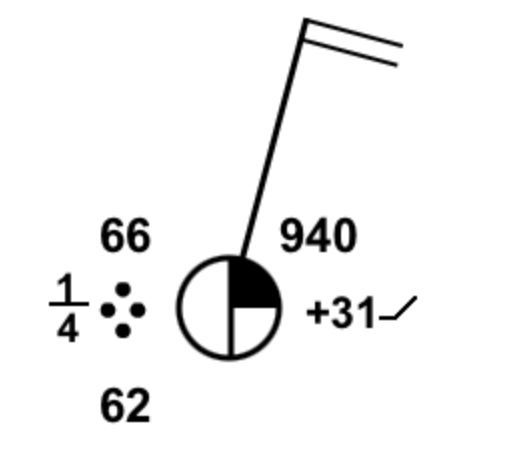
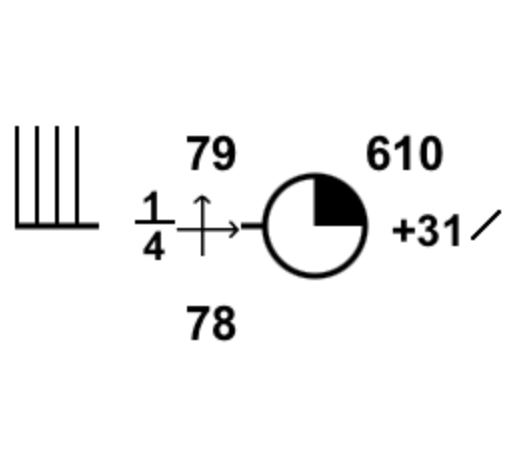
Exercise 1: Here are a few practice exercises decoding station weather plots.
Exercise 2: Search the web for maps that show where weather observations are made today (or recently).
Exercise 3: Search the web for satellite loops that cover your location. Compare these images with the weather you see out the window, and make a short-term forecast based on the satellite loop.
Exercise 4: Search the web to find the most recent set of visible, IR, and water-vapor images that covers your area. Download these images; label cloud areas as (a), (b), etc.; and interpret the clouds in those images. For the cloud area directly over you, compare you satellite interpretation with the view out your window.
Exercise 5: What shade of grey would the following clouds appear in visible, IR, and water-vapor satellite images, and what pattern or shape would they have in the images?
jet contrail
two cloud layers: cirrus & altostratus
two cloud layers: cirrus & stratus
three cloud layers: cirrus, altostratus, stratus e. two cloud layers: fog and altostratus
altocumulus standing lenticular
altocumulus castellanus
billow clouds
fumulus
volcanic ash clouds
Exercise 6: Monitor the weather maps on the web every day for a week or more over Europe. Identify the low centers and fronts. Discuss the variety of arrangements of warm, cold, and occluded front that you observe.
Exercise 7: Use a sequence of weather maps every 6 or 12 h for a week, where each map is spanning a large portion of the globe. Finde one or more locations that exhibits the following mechanism for formation of a surface high pressure:
global circulation
monsoon
Rossby wave
thunderstorm
topographic
Exercise 8: For a weather situation of relatively zonal flow from west to east over Europe, access upper air soundings for weather stations in a line more-or-less along the wind direction. Show how the sounding evolves as the air flows over the continent.
Exercise 9: Same as previous exercise, but identify the frontal inversions (or frontal stable layers) aloft in the sounding.
Exercise 10: Identify a region with high CAPE and look at the nearest station with an upper air sounding. Create a skew-T diagram and determine the LCL, LFC and CAPE.
Exercise 11: Why are there no extratropical cyclone tracks from east to west?
Exercise 12: Search the internet for satellite images of an air mass thunderstorm. Do this for visible, IR, and water vapor channels. Discuss the features of you resulting images.


